As a Windows user, if you want to check or track your internet activity like if you want to check who and when your network is used or which things are done, then here is a simple method to track all internet activity.
First of all, go to your windows 10 search box and type “Windows Defender Firewall With Advanced Security”.Click the app and open it.
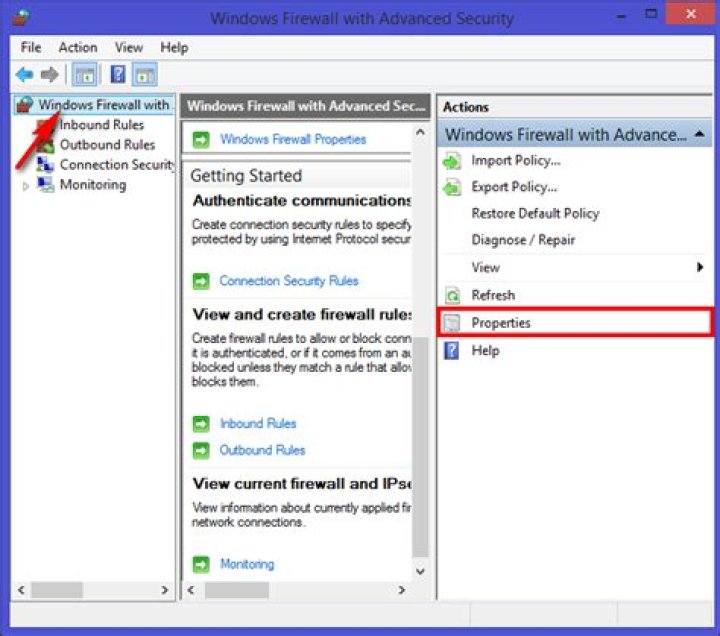
On the next step select the “Windows Firewall with Advanced Security on Local Computer” option placed on the left pane to access the log settings. After that, click on the properties from the right pane.
on the new pop-up window, you will see up the “Logging ” option for all the tabs. Here’s what each tab represents.
[*] Domain Profile:
This is a profile that you need to access if you are working on the connection that is a wifi network where the domain name is given by the domain controller. You may not need to access this profile, as it is not usually used in home networks.
[*] Private Profile:
This is the profile you will require to access if you are working in any private network connection. This also includes your home and personal networks. This is the selection you are more likely to access.
[*] Public Profile:
This is the profile you will require to access if you are working on a public network connection like public WiFi.
Depending upon the type of connection, you have just selected the log option for that tab only.
Now the time comes where you will; have to start the logging process. to do that just set up both of the drop-down menus to “Yes” and then come out of the panel by clicking the OK button.
After completion of the above step, your computer will start logging the whole firewall activity. to view these logs, again head to the “Advanced Settings” window, and here you will find the “Monitoring ” option on the left and then under the “Logging Settings”. Click the link behind the file name.
This file is the log file, and hence it will open on the device’s screen.
Well, if you have been using Windows 10 for a while, you might know that the operating system offers lots of security and privacy feature. For internet security, it has a built-in firewall system that allows you to allow /block programs from using an internet connection.
The firewall system of Windows 10 is of great use. However, it could be even more effective if you know how to use the Firewall system. With Windows 10 firewall, you can better control what goes in and out of your system.
You can even set up Windows Firewall to log connections that go through it. However, enabling logs for Windows Firewall is a complicated process as it requires lots of menu diving and settings. So, if you are interested in tracking internet activity using a Windows firewall log, you need to implement the steps given in this article.
Steps to track Internet Activity Using Windows Firewall
This article will share a detailed guide on how to track internet activity using a Windows Firewall log. So, let’s check out.
Step 1. First of all, open Windows 10 search and type in ‘Firewall.’ Open the Windows Defender Firewall option.
Step 2. On the next page, click on the ‘Advanced Settings’ option.
Step 3. Select the “Windows Firewall with Advanced Security on Local Computer” option placed on the left pane to access the Log settings. After that, click on the properties from the right pane.
Step 4. You can see up the “Logging” option for all the tabs. Here’s what each tab represents.
Domain Profile: This is a profile that you need to access if you are working on the connection that is Wifi network where the domain name is given by the Domain controller. You may not need to access this profile, as it is not usually used in home networks.
Private Profile: This is the profile you will require to access if you are working on any private network connection. This also includes your home and personal networks. This is the selection you are more likely to access.
Public Profile: This is the profile you will require to access if you are working on any public network connection like Public WiFi. Depending on the type of connection, you have just selected up the Log option for that tab only.
Step 5. Now the time comes where you will; have to start the Logging process. To do that, Just set up both of the drops down menus to “Yes” and then come out of the Panel by clicking the OK button.
Step 6. After the above step is completed, the computer will start logging the whole firewall activity. To view the log, head to the Advanced Settings window, click the “Monitoring” option on the left, and then under the “Logging Settings,” Click the link behind the File name.
Step 7. This file is the Log file, and hence it will open on the device’s screen.
Here’s what each of the parts marked in the screenshot represents
1. The section shows the date and time when the connection is established.
2. The section shows whether Firewall has allowed the connection or blocked it. The Allow means the connection is through, while ‘Drop’ means Firewall has blocked it.
3. The section represents the type of connection – TCP or UDP
4. The section shows the following in order – The IP Address of your PC, the IP of the destination, and the port used on your computer.
5. The section represents whether your computer has sent a packet of data or received one.
Analyzing the Firewall look might look complicated, but once you master it, it becomes easy. You first need to learn how to analyze certain aspects of the Firewall to utilize the feature fully.
This article is all about tracking internet activity for free by using a Windows Firewall log. I hope this article helped you! Please share it with your friends also. If you have any doubts about this, let us know in the comment box below.
Windows Firewall protects your hosts from network attacks, making it an important component of your network security system. Firewalls have the power to grant or deny the flow of traffic, ensuring only trusted parties are accessing your resources. The correct configuration of Windows Firewall settings is of concern for any security administrator, as changes can potentially result in security loopholes, making systems vulnerable to attacks. So, it is important for security administrators to audit their Windows Firewall event log data.
Using a Windows Firewall log analyzer, such as EventLog Analyzer, empowers you to monitor Windows Firewall activity with its comprehensive, predefined graphical reports, as well as analyze this information to gain useful insights. Auditing changes made to firewall configurations allows you to gain full control. In addition, with the real-time security alerts via SMS or email, any attack on the network can be quickly identified and mitigated.
Windows Firewall log auditing
Use EventLog Analyzer to conduct Windows Firewall audits. Track changes made to settings and configurations, including configuration resets and group policy changes. Keep an eye on all firewall rule changes, including rules that are added, deleted, or modified. A firewall rule change, be it by mistake or with malicious intent, might grant resource access to someone who isn’t supposed to have access, which can put your systems at risk.
Keep track of all these changes with the solution’s Windows Firewall log reports to ensure that it is set up properly at all times.
Identify Windows Firewall attacks
In addition to Windows Firewall reporting, EventLog Analyzer offers predefined threat alerts as well. The solution constantly scans log messages for threats, generating SMS and email alerts as soon as attacks occur. Real-time alerts help you quickly combat flood attacks, spoof attacks, SYN attacks, Ping of Death attacks, and half scan attacks. You can also go one step further and automatically run programs when alerts are triggered to quickly mitigate security threats on your network. EventLog Analyzer’s real-time alerts for Windows Firewall help protect your network from attacks.
Monitor Windows firewall activity.
Thanks!
Your download is in progress and it will be completed in just a few seconds!
If you face any issues, download manually here
This topic explains how to collect Windows Firewall logs.
Windows Firewall provides local protection from network attacks that might pass through your perimeter network or originate inside your organization. It also provides computer-to-computer connection security by allowing you to require authentication and data protection for communications.
NXLog can be configured to collect Windows Firewall logs.
133.1. Logging Windows Firewall traffic information
The Windows Firewall can be configured to log traffic information via the Advanced Security Log. These logs can provide valuable information like source and destination IP addresses, port numbers, and protocols for both blocked and allowed traffic. The log file follows the standard W3C format—see W3C Extended Log File Format section for more information.
There are several different actions that can be logged in the action field: DROP for dropping a connection, OPEN for opening a connection, CLOSE for closing a connection, OPEN-INBOUND for an inbound session opened to the local computer, and INFO-EVENTS-LOST for events processed by the Windows Firewall but which were not recorded in the Security Log.
For information about configuring the Windows Firewall Security log, please refer to Configure the Windows Defender Firewall with Advanced Security Log on Microsoft Docs.
This example configuration collects and parses firewall logs using the im_file and xm_w3c modules.
133.2. Auditing the activity of Windows Firewall
Change auditing of Windows Firewall is part of a defense-in-depth strategy because it can be used to generate alerts about malicious software that is attempting to modify firewall settings. Auditing can also help administrators determine the network needs of their applications and design appropriate policies for deployment to users.
There are several ways to enable Windows Firewall audit logging.
Open the Local Security Settings console.
In the console tree, click Local Policies, and then click Audit Policy.
In the details pane of the Local Security Settings console, double-click Audit policy change. Select Success and Failure, and then click OK.
In the details pane of the Local Security Settings console, double-click Audit process tracking. Select Success and Failure, and then click OK.
Alternatively, audit logging can be enabled for multiple computers in an Active Directory domain using Group Policy. Modify the Audit Policy Change and Audit Process Tracking settings at Computer Configuration\Windows Settings\Security Settings\Local Policies\Audit Policy for the Group Policy objects in the appropriate domain system containers.
Finally, the following command can be used to enable Windows Firewall audit logs.
After audit logging is enabled, audit events can be viewed in the Security event log or collected with NXLog. For a full list of Windows Security Audit events, download the Windows security audit events spreadsheet from the Microsoft Download Center.
This example collects Windows Firewall events from Windows Event Log using the im_msvistalog module.
133.3. Collecting Windows Firewall logs from ETW
Event Tracing for Windows (ETW) is a logging and tracing mechanism used by developers. ETW includes event logging and tracing capabilities provided by the operating system. Implemented in the kernel, it traces events in user mode applications, the operating system kernel, and kernel-mode device drivers. For more information, see Event Tracing on Microsoft Docs.
This configuration uses the im_etw module to collect Windows Firewall related traces from Event Tracing for Windows.
While we endeavor to keep the information in this topic up to date and correct, NXLog makes no representations or warranties of any kind, express or implied about the completeness, accuracy, reliability, suitability, or availability of the content represented here.
just wondering about ‘average’ number of events coming from windows firewall in case allowed and blocked connections are audited. I understand that there is no ‘average’ due to variety of usage profiles, but any data would be appreciated. Thank you.
All replies
The firewall does not log in the event viewer (if that is what you mean). It logs in a file when logging is enabled on the active profile, %systemroot%\system32\LogFiles\Firewall\pfirewall.log by default.
As you state no average. What would affect that for dropped packets what else is on the local network. Out going what the user does. So if the user has RSS feeds or torrent or checks social media every 2 minutes then that would be a lot more.
I viewed a few webpages, watched a 3 minutes video and it logged 780 odd allows. Port scanned my PC on all ports listed 10 blocked.
Hope that helps.
Hi, thank you for the answer, I meant event log, you’re right. You can enable firewall logging and the logs will be visible in event viewer, if interested please check group policy Computer configuration -> Windows Settings -> Security Settings -> Advanced audit policy configuration -> System audit policies -> Object access (Audit filtering platform connection|Audit filtering platform packet drop). Logged Event IDs are:
I’m planning to get those logs to a central logging server and then to SIEM, but cannot find event per second parameter just to understand if it is really feasible to handle such amount of data in my environment.
Unfortunately I don’t have test lab yet and IT is too conservative to test it on a couple of production machines (I’m Information Security guy).
So I keep looking for alternative sources of information.
Ok thanks. I do come here to learn and never seen that or needed it so new to me so thanks.
So enabled that on a Domain PC, rebooted logged in 8000 events! That is filtering the Security log on 5150,5151,5154-5159.
This PC so non domain non rebooted 4000 events in 50 minutes.
Also to me those events are not that helpful are hard to search, might work better with logging block only or perhaps would need to write PowerShell scripts to report on the events.
No test at all? Can you not turn this in secpol on your machine to test it?
My home test setup is one moderate PC, I3 CPU,16GB memory & 1 TB disk. Runs Hyper-V Server Evaluation (excellent time offer on that) and runs me a 2 DC domain and test PC no problems.
I cannot test it in a more or less ‘real’ scenario, I enabled the settings on my home laptop and it gave me about 50000 events in 28 hours without user activity. Hope it will be no more than 100000/24H for real life, and assuming a user is active 9-10 hours a day it will give 1 or less event per second.
Yep, you cannot find interesting events without additional tools, in my case it is Qradar or McAfee SIEM solutions. The events like this can be extremely useful when you try to catch someone in your network.
There is a guide how to use windows events to help you detect an intrusion
Actually, I’m trying to eliminate a blind spot: I see traffic between my subnets, but cannot see network activity inside one subnet.
Now I’m on ‘pre proof-of-concept’ stage and trying to gather information from different sources.
You can monitor Azure Firewall using firewall logs. You can also use activity logs to audit operations on Azure Firewall resources. Using metrics, you can view performance counters in the portal.
You can access some of these logs through the portal. Logs can be sent to Azure Monitor logs, Storage, and Event Hubs and analyzed in Azure Monitor logs or by different tools such as Excel and Power BI.
This article was recently updated to use the term Azure Monitor logs instead of Log Analytics. Log data is still stored in a Log Analytics workspace and is still collected and analyzed by the same Log Analytics service. We are updating the terminology to better reflect the role of logs in Azure Monitor. See Azure Monitor terminology changes for details.
This article has been updated to use the Azure Az PowerShell module. The Az PowerShell module is the recommended PowerShell module for interacting with Azure. To get started with the Az PowerShell module, see Install Azure PowerShell. To learn how to migrate to the Az PowerShell module, see Migrate Azure PowerShell from AzureRM to Az.
Prerequisites
Before starting, you should read Azure Firewall logs and metrics for an overview of the diagnostics logs and metrics available for Azure Firewall.
Enable diagnostic logging through the Azure portal
It can take a few minutes for the data to appear in your logs after you complete this procedure to turn on diagnostic logging. If you don’t see anything at first, check again in a few more minutes.
In the Azure portal, open your firewall resource group and select the firewall.
Under Monitoring, select Diagnostic settings.
For Azure Firewall, four service-specific logs are available:
- AzureFirewallApplicationRule
- AzureFirewallNetworkRule
- AzureFirewallDnsProxy
Select Add diagnostic setting. The Diagnostics settings page provides the settings for the diagnostic logs.
In this example, Azure Monitor logs stores the logs, so type Firewall log analytics for the name.
Under Log, select AzureFirewallApplicationRule, AzureFirewallNetworkRule, and AzureFirewallDnsProxy to collect the logs.
Select Send to Log Analytics to configure your workspace.
Select your subscription.
Select Save.
Enable diagnostic logging by using PowerShell
Activity logging is automatically enabled for every Resource Manager resource. Diagnostic logging must be enabled to start collecting the data available through those logs.
To enable diagnostic logging with PowerShell, use the following steps:
Note your Log Analytics Workspace resource ID, where the log data is stored. This value is of the form: /subscriptions/
You can use any workspace in your subscription. You can use the Azure portal to find this information. The information is located in the resource Properties page.
Note the resource ID for the firewall. This value is of the form: /subscriptions/
You can use the portal to find this information.
Enable diagnostic logging for all logs and metrics by using the following PowerShell cmdlet:
Enable diagnostic logging by using the Azure CLI
Activity logging is automatically enabled for every Resource Manager resource. Diagnostic logging must be enabled to start collecting the data available through those logs.
To enable diagnostic logging with Azure CLI, use the following steps:
Note your Log Analytics Workspace resource ID, where the log data is stored. This value is of the form: /subscriptions/
You can use any workspace in your subscription. You can use the Azure portal to find this information. The information is located in the resource Properties page.
Note the resource ID for the firewall. This value is of the form: /subscriptions/
You can use the portal to find this information.
Enable diagnostic logging for all logs and metrics by using the following Azure CLI command:
View and analyze the activity log
You can view and analyze activity log data by using any of the following methods:
Azure tools: Retrieve information from the activity log through Azure PowerShell, the Azure CLI, the Azure REST API, or the Azure portal. Step-by-step instructions for each method are detailed in the Activity operations with Resource Manager article.
Power BI: If you don’t already have a Power BI account, you can try it for free. By using the Azure Activity Logs content pack for Power BI, you can analyze your data with preconfigured dashboards that you can use as is or customize.
Azure Sentinel: You can connect Azure Firewall logs to Azure Sentinel, enabling you to view log data in workbooks, use it to create custom alerts, and incorporate it to improve your investigation. The Azure Firewall data connector in Azure Sentinel is currently in public preview. For more information, see Connect data from Azure Firewall.
See the following video by Mohit Kumar for an overview:
View and analyze the network and application rule logs
Azure Firewall Workbook provides a flexible canvas for Azure Firewall data analysis. You can use it to create rich visual reports within the Azure portal. You can tap into multiple Firewalls deployed across Azure, and combine them into unified interactive experiences.
You can also connect to your storage account and retrieve the JSON log entries for access and performance logs. After you download the JSON files, you can convert them to CSV and view them in Excel, Power BI, or any other data-visualization tool.
If you are familiar with Visual Studio and basic concepts of changing values for constants and variables in C#, you can use the log converter tools available from GitHub.
View metrics
Browse to an Azure Firewall. Under Monitoring, select Metrics. To view the available values, select the METRIC drop-down list.
Next steps
Now that you’ve configured your firewall to collect logs, you can explore Azure Monitor logs to view your data.
In network architectures in Azure where Azure Firewall is present, the firewall-as-a-service solution (FWaaS) which allows to secure the resources present in the Virtual Networks and to govern the related network flows, it becomes strategic to adopt tools to effectively monitor the relevant logs. This article explores how to best interpret logs and how you can do in-depth analysis of Azure Firewall, a component that often plays a fundamental role in network architectures in Azure.
An important aspect to check is that the diagnostic settings are correctly configured in Azure Firewall, to flow log data and metrics to an Azure Monitor Log Analytics workspace.
Figure 1 – Azure Firewall diagnostic settings
To get an overview of the diagnostic logs and metrics available for Azure Firewall, you can consult the specific Microsoft documentation.
One of the most effective ways to view and analyze Azure Firewall logs is to use Workbooks, that allow you to combine text, Log Analytics query, Azure metrics and parameters, thus conseasing interactive and easily searchable reports.
For Azure Firewall there is a specific workbook provided by Microsoft that allows you to obtain detailed information on events, know the applications and network rules activated and view the statistics on firewall activity by URL, ports and addresses.
The import of this workbook can be done via ARM template or Gallery template, following the instructions in this article.
Figure 2 – Azure Firewall Workbook Import
After completing the import process, you can consult the overview an overview of the different events and types of logs present (application, Networks, threat intel, DNS proxy), with the possibility of applying specific filters related to workspaces, time slot and firewalls.
Figure 3 – Azure Firewall Workbook overview
There is a specific section in the workbook for Application rule where are shown sources by IP address, the use of application rules, and FQDNs denied and allowed. Furthermore, you can apply search filters on application rule data.
Figure 4 – Azure Firewall Workbook – Application rule log statistics
Furthermore, in the section Network Rule you can view the information based on the actions of the rules (allow/deny), target ports and DNAT actions.
Figure 5 – Azure Firewall Workbook – Network rule log statistics
If Azure Firewall has been set to work also as DNS Proxy it is possible to view in the tab “Azure Firewall – DNS Proxy” of the Workbook also information regarding the traffic and DNS requests managed.
If it is necessary to carry out further information to obtain more information on the communications of specific resources, you can use the section Investigation going to act on the filters available.
Figure 6 – Azure Firewall Workbook – Investigation
To view and analyze activity logs, you can connect Azure Firewall logs to Azure Sentinel, the service that expands the capabilities of traditional SIEM products (Security Information and Event Management), using the potential of the cloud and artificial intelligence. In this way, through specific workbooks available in Azure Sentinel, you can expand your analytics capabilities and create specific alerts to quickly identify and manage security threats that affect this infrastructure component. To connect Azure Firewall logs to Azure Sentinel you can follow the procedure in this Microsoft’s document.
Conclusions
Azure Firewall is a widely used service and is often the centerpiece of your network architecture in Azure, where all network communications transit and are controlled. It therefore becomes important to date yourself with a tool to analyze the metrics and information collected, able to provide valid support in the resolution of any problems and incidents. Thanks to the adoption of these Workbooks you can easily consult the data collected by Azure Firewall, using visually appealing reports, with advanced features that allow you to enrich the analysis experience directly from the Azure portal.
Firewalls are a critical part of any organization’s defense in depth strategy. They serve a key role in protecting your network against malicious actors, and they do this well. But they also have a dirty little secret.
Firewalls aren’t a set-it-and-forget-it device. They need tending and maintenance.
Many organizations don’t devote enough time to maintaining and tuning their security infrastructure. They turn on their firewalls and assume they’re protected. But the truth is, you need to monitor and analyze firewall logs to get the most out of these critical network devices.
In this post, we’re going to dive into five tips for improving your firewall log analysis skills. I’m going to talk about ways you can maximize the value from the time you spend analyzing your firewall logs and ways you can use those skills to automate a lot of this analysis. By the time we’re done, you should know what you need to add to your current process to improve your organization’s security.
1. Keep the Documentation Handy
I know this seems simple, but you’d be surprised how often people overlook documentation. Most firewall logs aren’t designed to be read by humans. They’re written in a foreign language with its own syntax and style.
What’s more, each vendor has its own style and syntax for firewall logs. This means devices from one vendor will have their own unique peculiarities. If you’ve worked with one vendor for a long time and you switch to another, you’re likely to experience some growing pains.
By keeping the documentation for your firewall vendor handy, you make it easy on yourself when you find a log entry you don’t immediately recognize. Most of the log messages you’ll see will be mundane. However, some messages might look unusual at first glance. These log entries may be signs of malicious behavior, or they may be nothing. The only way to tell the difference is to investigate, and the best place to start your investigation is with documentation.
2. Understand Your Network Topology
Most firewall logs don’t provide much information to the uninitiated. You’ll see a couple of IP addresses, ports, and information about whether the firewall blocked the request. If you’re scanning through firewall logs looking for indications of bad behavior, there’s not much to go on.
Unfortunately, bad behavior often hides in plain sight. A request on port 80 or 443 headed toward a web server is no big deal. But the same request headed toward an employee desktop is bad news. Your job while looking at firewall logs is to be able to tell the difference between the two at a glance. To do this, you need to understand your organization’s network topology inside and out.
One key mistake many experienced engineers make is not keeping up to speed on network changes. They memorize the network map at some point and rarely go back to it. Weeks or months later, they see a firewall entry that looks a little funny. They only then discover they’ve missed some critical server in their logs up to this point. If they weren’t a part of the provision process, they miss it completely, and then they need to go back and figure out if anything they missed exposed the organization to unacceptable risk.
If you end up in this situation, the extra work often takes you away from something important. And I can say from experience, it feels terrible. Instead, regularly check in on your network topology to understand new servers and servers your organization decommissions.
Want to improve this question? Update the question so it’s on-topic for Information Security Stack Exchange.
Closed last year .
I am going through some event logs (in event viewer), and noticed I can’t seem to find any firewall logs. Windows Defender provides the firewall. How do I get to the firewall logs that should be generated by Windows Defender, or are they not even generated? I have searched through event viewer, the Windows Defender firewall GUI, and google searches have been unsuccessful (they generally point to older versions of Windows not using Windows Defender)!
1 Answer 1
Applies to
- Windows 10
- Windows Server 2016
To configure Windows Firewall to log dropped packets or successful connections, use the Windows Firewall with Advanced Security node in the Group Policy Management MMC snap-in.
Administrative credentials
To complete these procedures, you must be a member of the Domain Administrators group, or otherwise be delegated permissions to modify the GPOs.
To configure the Windows Firewall log
Open the Group Policy Management Console to Windows Firewall with Advanced Security (found in Local Computer Policy > Computer Configuration > Windows Settings > Security Settings > Windows Firewall with Advanced Security).
In the details pane, in the Overview section, click Windows Firewall Properties.
For each network location type (Domain, Private, Public), perform the following steps:
Click the tab that corresponds to the network location type.
Under Logging, click Customize.
The default path for the log is %windir%\system32\logfiles\firewall\pfirewall.log . If you want to change this, clear the “Not configured” check box and type the path to the new location, or click “Browse” to select a file location.
Important: The location you specify must have permissions assigned that permit the Windows Firewall service to write to the log file.
The default maximum file size for the log is 4,096 kilobytes (KB). If you want to change this, clear the Not configured check box, and type in the new size in KB, or use the up and down arrows to select a size. The file will not grow beyond this size; when the limit is reached, old log entries are deleted to make room for the newly created ones.
No logging occurs until you set one of following two options:
To create a log entry when Windows Firewall drops an incoming network packet, change “Log dropped packets” to “Yes.”
To create a log entry when Windows Firewall allows an inbound connection, change “Log successful connections” to “Yes.”
Resources
If you have any more questions you can see this whole guide and read more into it here: